PlzMayI > USB port Monitoring | Articles | Testimonials | White Papers | Software Services
PlzMayI> N/W Monitoring | Application Monitoring | Syslog | Trouble-Ticketing | ODBC | Report Generator | Scripting
 
Application Monitoring  
PlzMayI Specifications | Download Brochure:  PDF

In the age of Web-based systems, system and application performance is dependent on many components, some you control and some you don't.

No one knows that better than IT, which hears about it when one link in the chain breaks, even for a few minutes.

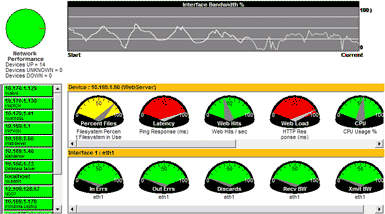
Performance Dashboard


SoftShadowSecurity's PlzMayI Application Monitoring for Web, E-Mail and Database servers can continuously check their performance. You can establish thresholds to alert on specific conditions for immediate
remedial action or by using the real time and historical monitoring data of server functions assess sporadic performance problems such as end-to-end response time or processes consuming excess resources.


As an example you can monitor MS Exchange processes such as mail flow, delays, number of current users and set policies to activate actions upon encountering a variety of conditions.

Application Monitoring points in a Graphical Representation

Application monitoring adds protocol performance and response time of specific applications. It also acts on threshold settings for application- specific data. Including:

  • CPU, memory, swap, disk space
  • Log file, process monitoring
  • Threshold alerts
  • HTTP for Web page response time
  • SNMP for DNS, POP3, FTP, etc..

Monitor the following and many more applications:

  • Apache Webserve
  • Microsoft IIS
  • Microsoft Exchange Server
  • Microsoft SQL Server
  • MySQL
  • Oracle
 
Send a Mail to SoftShadowSecurity Sales SoftShadowSecurity Home Page Copyright